Client and sector
Korubin is the water management platform of Kayseri-based Envest Enerji ve Su Teknolojileri. The heading of the korubin.com login page names Envest's Koru1000 Water Management System. Envest was founded in 2012. It produces field devices and web-based software for wells, reservoirs, booster stations and pressure control. Its field of work is the supply and distribution of drinking water.
The brief
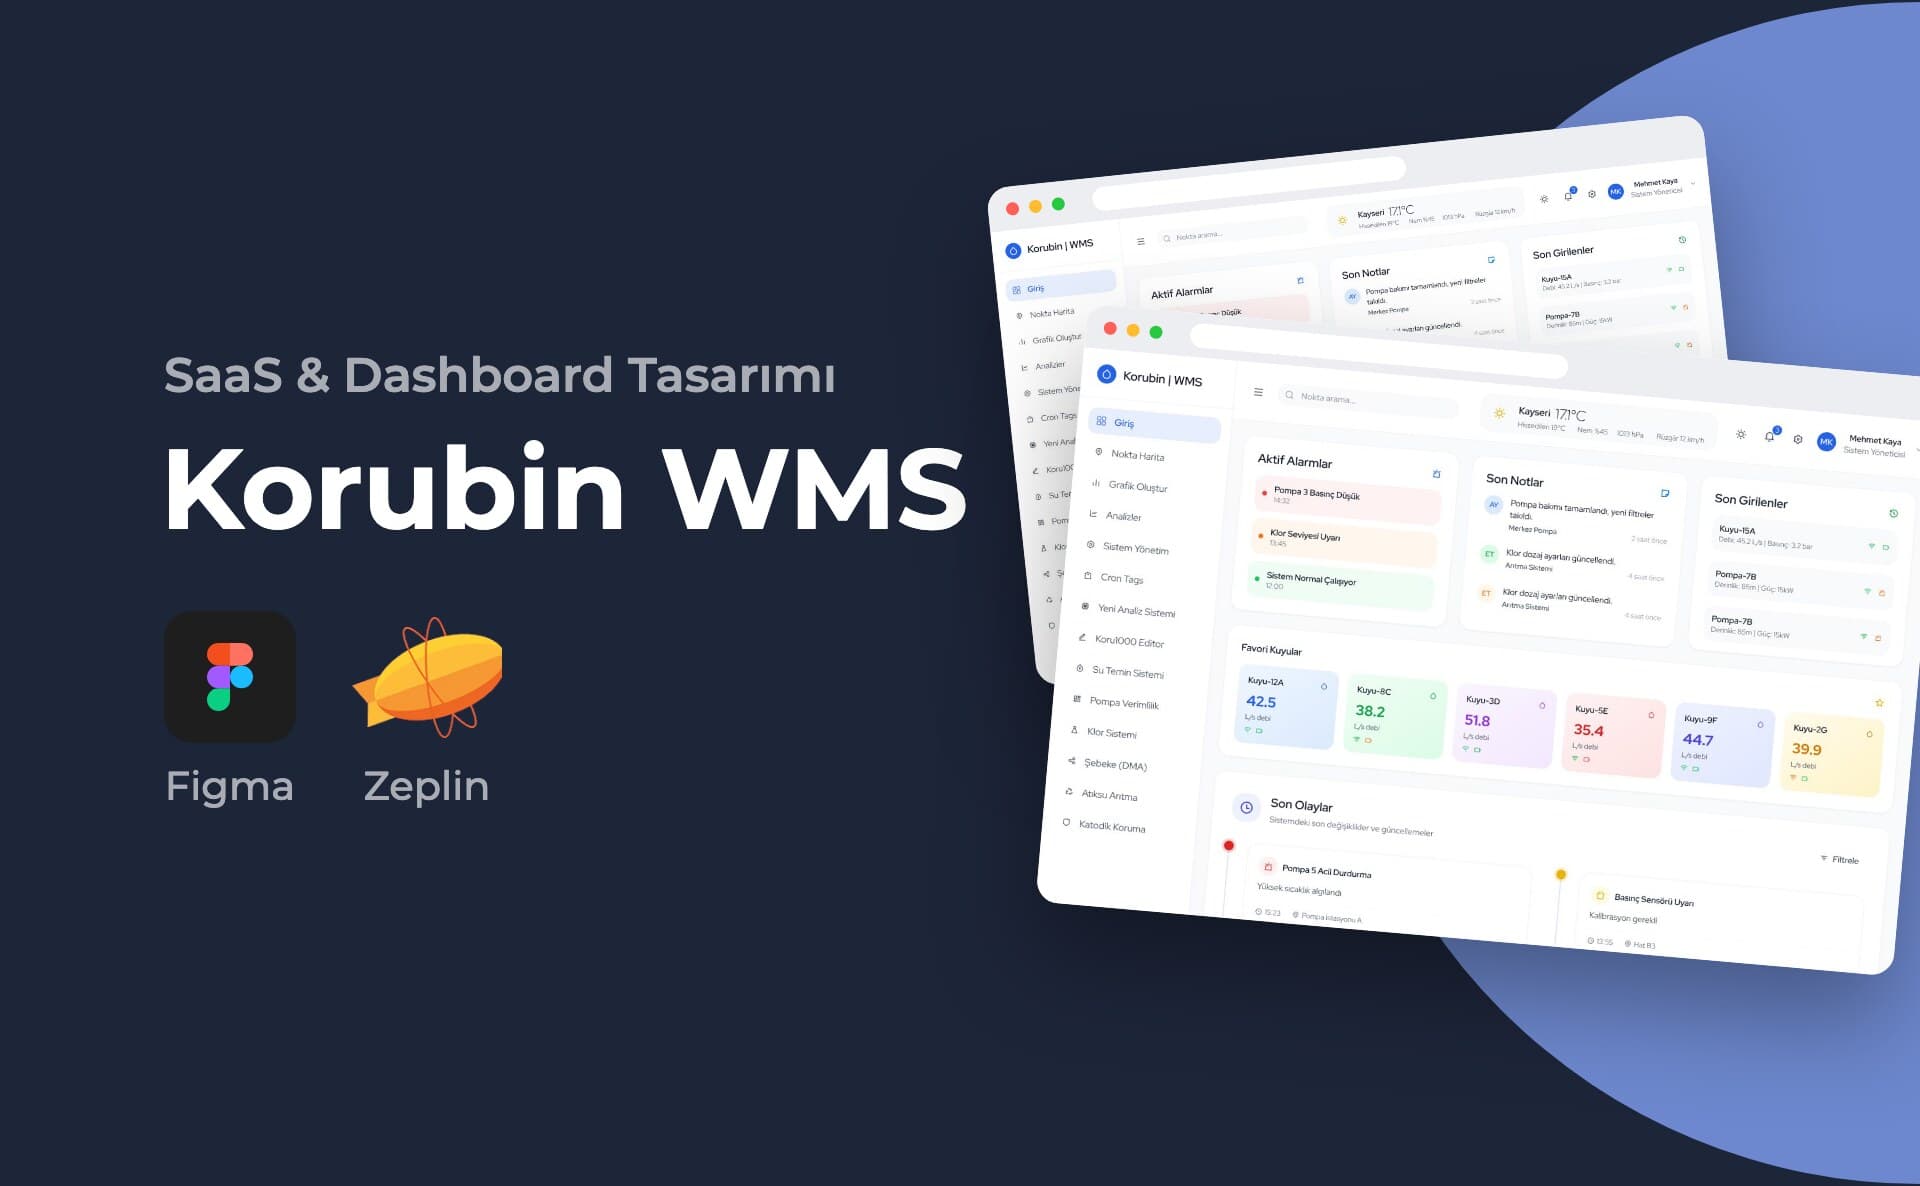
In a water network, an operator monitors many points at the same time. Well flow rates, pump status, chlorine dosing and pressure sensors come from separate sources. The dashboard's home screen brings this information together on a single page. The page order is built around this: alarms at the top, events in the middle and the overall status at the bottom.
My role and scope
I designed the dashboard's interface. The work in the portfolio is the application's home screen. The left menu has fourteen headings. Point Map, Analyses, Pump Efficiency, Chlorine System, Network (DMA), Wastewater Treatment and Cathodic Protection are some of them. This page covers only the home screen.
Process and design decisions
I built the screen from top to bottom in order of priority.
- The top bar holds point search, live weather for Kayseri, notifications and the user role.
- The first row has three cards: Active Alarms, Recent Notes and Recent Entries. Alarms are distinguished by red, orange and green backgrounds. Each alarm's text and time are also written out, so the status does not depend on colour alone.
- The Favourite Wells section has six cards. On each card the flow rate (L/s) stands out in large type. Connection and device status are shown with small icons.
- Recent Events is a two-column timeline. Each event has a title, short description, time and location. Events such as pump emergency stop, sensor calibration and maintenance record are distinguished by coloured dots.
- Water Flow Analysis is an area chart showing 24 hours.
- System Status summarises four components: main pump, chlorine dosing, pressure sensor and communication. Each has a progress bar and one of the labels "Aktif" (Active), "Normal", "Uyarı" (Warning) or "Alarm".
I used a light background and soft-cornered cards to divide the dense data into sections. I kept generous spacing between the cards.
Deliverables
- Full-page desktop design of the home screen
- Presentation visual of the same screen inside a browser frame
Outcome
The portfolio shows the full-page design of the home screen.
This project is an example of my SaaS and dashboard design service.